

Rows of power-generating turbines sit on a lot in Southaven, Mississippi, fed by a natural gas pipeline. The turbines burn the gas to generate electricity, which runs through wires a mile north to a cluster of buildings straddling the Tennessee line. Inside those buildings, more than half a million computer chips — powered by nothing but those turbines — form one of the world’s most famous data centers.
“Colossus 2 now operational. First Gigawatt training cluster in the world. Upgrades to 1.5GW in April,” Elon Musk posted in January.
Two sets of records — xAI’s own turbine data and the gas pipeline’s daily reports — say the same thing: Colossus 2’s chips were drawing about 0.55 gigawatts in June. I’ve written up the evidence and math in Half a Colossus, below.
Until the last couple years, almost no one ever said “gigawatt,” or wrote the letters that abbreviate it, GW. If you’ve never used the word yourself, clearly you’re doing something right with your life. But even among those who use it a lot, it doesn’t always have the same meaning, which is a key part of the problem here.
In the utility world, a watt is a basic unit that measures how much electricity is used, instantaneously, to power something. Phone charger: about 20 watts; hair dryer: 1,500; central AC: 5,000; Colossus 2 data center, on paper: 1,000,000,000. To deal with the zeroes, people often use kilowatt (thousand watts), or megawatt (million watts), or now, increasingly, gigawatt (billion watts).
In the data center world, one GW is a cluster of computer chips that — if they’re all running flat-out — draw 1,000,000,000 watts. The important word in that sentence: if.
From here, I promise it gets more interesting if you care about any of these things:
AI’s bubble. At the heart of AI economics are its expensive computer chips — and the math only works if they’re running.
AI’s data centers are half-dark. Ed Zitron has done extraordinary work to expose how chips aren’t getting deployed to data centers, in the first place. Now it looks like the chips that do aren’t being fully utilized.
Electric utilities are building for fully lit data centers. They’re building power plants and wires — hundreds of billions of dollars under construction or advanced planning — for capacity that likely won’t be used.
Half a Colossus
Colossus 2’s computer chips used about 0.55 gigawatt (GW) of power in June, or about half the 1.1 gigawatt implied by xAI’s parent, SpaceX, in a quarterly earnings report submitted to the Securities and Exchange Commission (SEC) in August.1
0.55 GW isn’t a guess. It’s the result of triangulating (a lot of) data.
(NB I’ve written another thousand 1,353 words about this data — and the assumptions I’ve made and the math I’ve done — in Footnote 1. I feared death-by-boredom for readers uninterested in the nuances of natural gas procurement, chip cooling, and turbine manufacturing. The short version follows below.)
Colossus 2’s electricity consumption is easy to follow, in a way, because those turbine in Mississippi are the only thing generating it. SpaceX describes them as “the mobile gas turbines powering the COLOSSUS II data center,” and the Memphis utility has said it isn’t supplying the supercomputer.
To figure out how much power Colossus 2 used in June, then, you just need to figure out how much power those turbines generated in June. It’s the same number.
The first way to figure out how much power those turbines generated is to figure out how much natural gas fed them. This is knowable: federal rules require gas pipelines to publish figures, daily, that detail how much gas is delivered to each major delivery point. On June 30, 2026 — the last day of the quarter for which SpaceX told the SEC it had 1.4 GW of IT capacity (which, because Colossus 1 has about 300 MW, implies 1.1 GW at Colossus 2) — Texas Gas Transmission delivered 184,800 MMBtu to the xAI site.
Turning 184,800 MMBtu of gas into gigawatts of electricity takes one number: the turbines’ burn rate, which describes how much gas the turbines burn to make power. If you google “heat rate combustion turbine EIA,” you can find the Energy Information Administration’s table, where the average U.S. gas turbine burns 10,975 Btu per (kilowatt) hour at full power. From there, it’s math:
184,800 MMBtu of gas per day * 1,000,000 (Btu per MMBtu) = 184.8B Btu per day
/ 10,975 Btu per kilowatt-hour
= 16.838 million kilowatt-hours per day
/ 24 hours = 701,595 kilowatts / 1,000,000 (kW per GW)
= 0.702 GW of power (avg.)
/ 1.2 (assumed PUE to account for non-chip (mostly cooling) facility power use)
= 0.585 GW of IT power
If the gas were all I had, I’d probably have published the 0.585 GW estimate here, but I’d have hedged, mostly because my heat-rate assumption could be slightly off. But still. It isn’t a listing of all the turbines on site, with how many hours each one ran, but the gas consumption data is a very good way to estimate power generation.
But then.
Rachel Hurley, who does outstanding investigative work at Rachel in the City, much of it about environmental and social impacts of xAI, published a story that included a bunch of documents she’d obtained. One was an email to Mississippi’s air regulators about xAI’s turbines. She didn’t use it the way I’m about to, but this is basically the ballgame.
The email contains a listing of all sixty turbines on site — with the exact hourly runtime, for each turbine, for the month of June.
From there, it’s simple math to estimate how much power was generated: each turbine’s output, times the hours it ran, added up. No Excel required; I did it on my Soulver app.
60 turbines (1,445 MW in all): each one’s megawatts, times the hours it ran in June
= 477,494 megawatt-hours of electricity for the month
/ 720 hours in June = 663,000 kilowatts
= 0.663 GW of power (avg.)
/ 1.2 (assumed PUE to account for non-chip (mostly cooling) facility power use)
= 0.553 GW of IT power
This is how much power Colossus 2 used in June: roughly 0.66 GW at the facility level, which means the chips used roughly 0.55 GW.2 In other words, Colossus 2’s chips were using about half a gigawatt of power in June, or about half the power the headlines would have you believe.
A useful exercise: flip the script. Imagine that we knew nothing about the onsite power capacity, and only had building sensors showing Colossus 2’s chips averaged 0.55 GW in June. That would raise questions, naturally, about why Colossus 2 wasn’t better utilizing its chips.
I can virtually guarantee you what the AI boosters would say:
They probably just didn’t have enough power supply! Government regulations! They’re electricity constrained! Supply chain! They’d use infinite power if it was available!
Musk recently told the G20 there will be a “shortfall of power in 2027 for AI chips,” a shortfall he measured in gigawatts. Microsoft’s Satya Nadella said last fall that “the biggest issue we are now having is not a compute glut, but it’s power … you may actually have a bunch of chips sitting in inventory that I can’t plug in.” BlackRock’s Larry Fink spent an entire CNN interview lamenting the shortage of electricity for AI, summing it up: “we don’t have enough power in the United States.”3
This idea falls apart at Colossus 2. In June, xAI’s turbines were capable of generating up to 1.45 gigawatts of power — and they produced 0.66, about 0.55 of which went to chips. If anything, it seems they had too much power generation onsite, far more than they needed: eight of xAI’s turbines didn’t run a single hour.
Two final words to get in front of the inevitable comments from AI boosters, which I expect to basically say: you clearly don’t know about AI computer chips, Sam; obviously a data center can’t run at 100% utilization.
Training, not inference. I know this campus is used to train AI models because SpaceX says so — its S-1 describes Colossus 2 as “currently powering training for our next frontier models” — and when chips are training, as Nvidia’s written, they’re basically running flat-out. 100%? Of course not, but it’s supposed to be way higher than 50%. Meta says its biggest training run kept the chips working more than 90% of the time; Google says 97%.
Economics. Presumably the data centers are, at some point, trying to make money? We know the cost-side here: Anthropic and Google are paying annual run rates (couldn’t resist) of $30 billion and $50 billion per gigawatt at Colossus; they pay the same no matter how much they use the chips. In order to have any chance of recouping any of that investment, they better start using those chips to generate tokens and make money.4
Colossus 2 was running at about 50% in June.
Data Center Alley
Loudoun County, Virginia uses that nickname less frequently these days, but it’s home to over two hundred data centers. The highest data center concentration on earth, with a big share (maybe 70% (WaPo), or less than 9% (real analysis), but whatever, something big!) of the entire internet running through them.
If the AI boom is a power boom anywhere, it’s here.
Virginia’s also the best place to get a sense for all these gigawatts, because the utility that powers the data centers, Dominion, reports their electricity consumption directly. Whereas other utilities include them in broader sectors (e.g., “commercial” or “industrial”), Dominion has broken them out for years.
New power demand from data centers added last year: 0.6 GW. That’s up from 0.45 in 2024, and 0.4 in 2023.
That’s a zero, then a decimal point, then a number. It’s another way of writing, “less than a gigawatt.” Here in Data Center Alley, it’d probably make more sense to communicate data center demand in megawatts, or kilowatts.
Dominion speaks in gigawatts when it’s talking to Wall Street. In its July 31 presentation to investors, the data slide used “GW” seventeen times. The GW in the center of the slide was associated with 53.8, which Dominion said was the total “data center contracted capacity,” up from 16.5 in 2023. (Actual electricity demand from all Dominion data centers in 2023: 3.2.) The closest the slide gets to the real world is 12.0, which is the gigawatts with a signed “Electric Service Agreement (ESA),” the contract to actually use the power. Nowhere on this slide, or in the 24 pages around it, will you find how much electricity the data centers actually used.
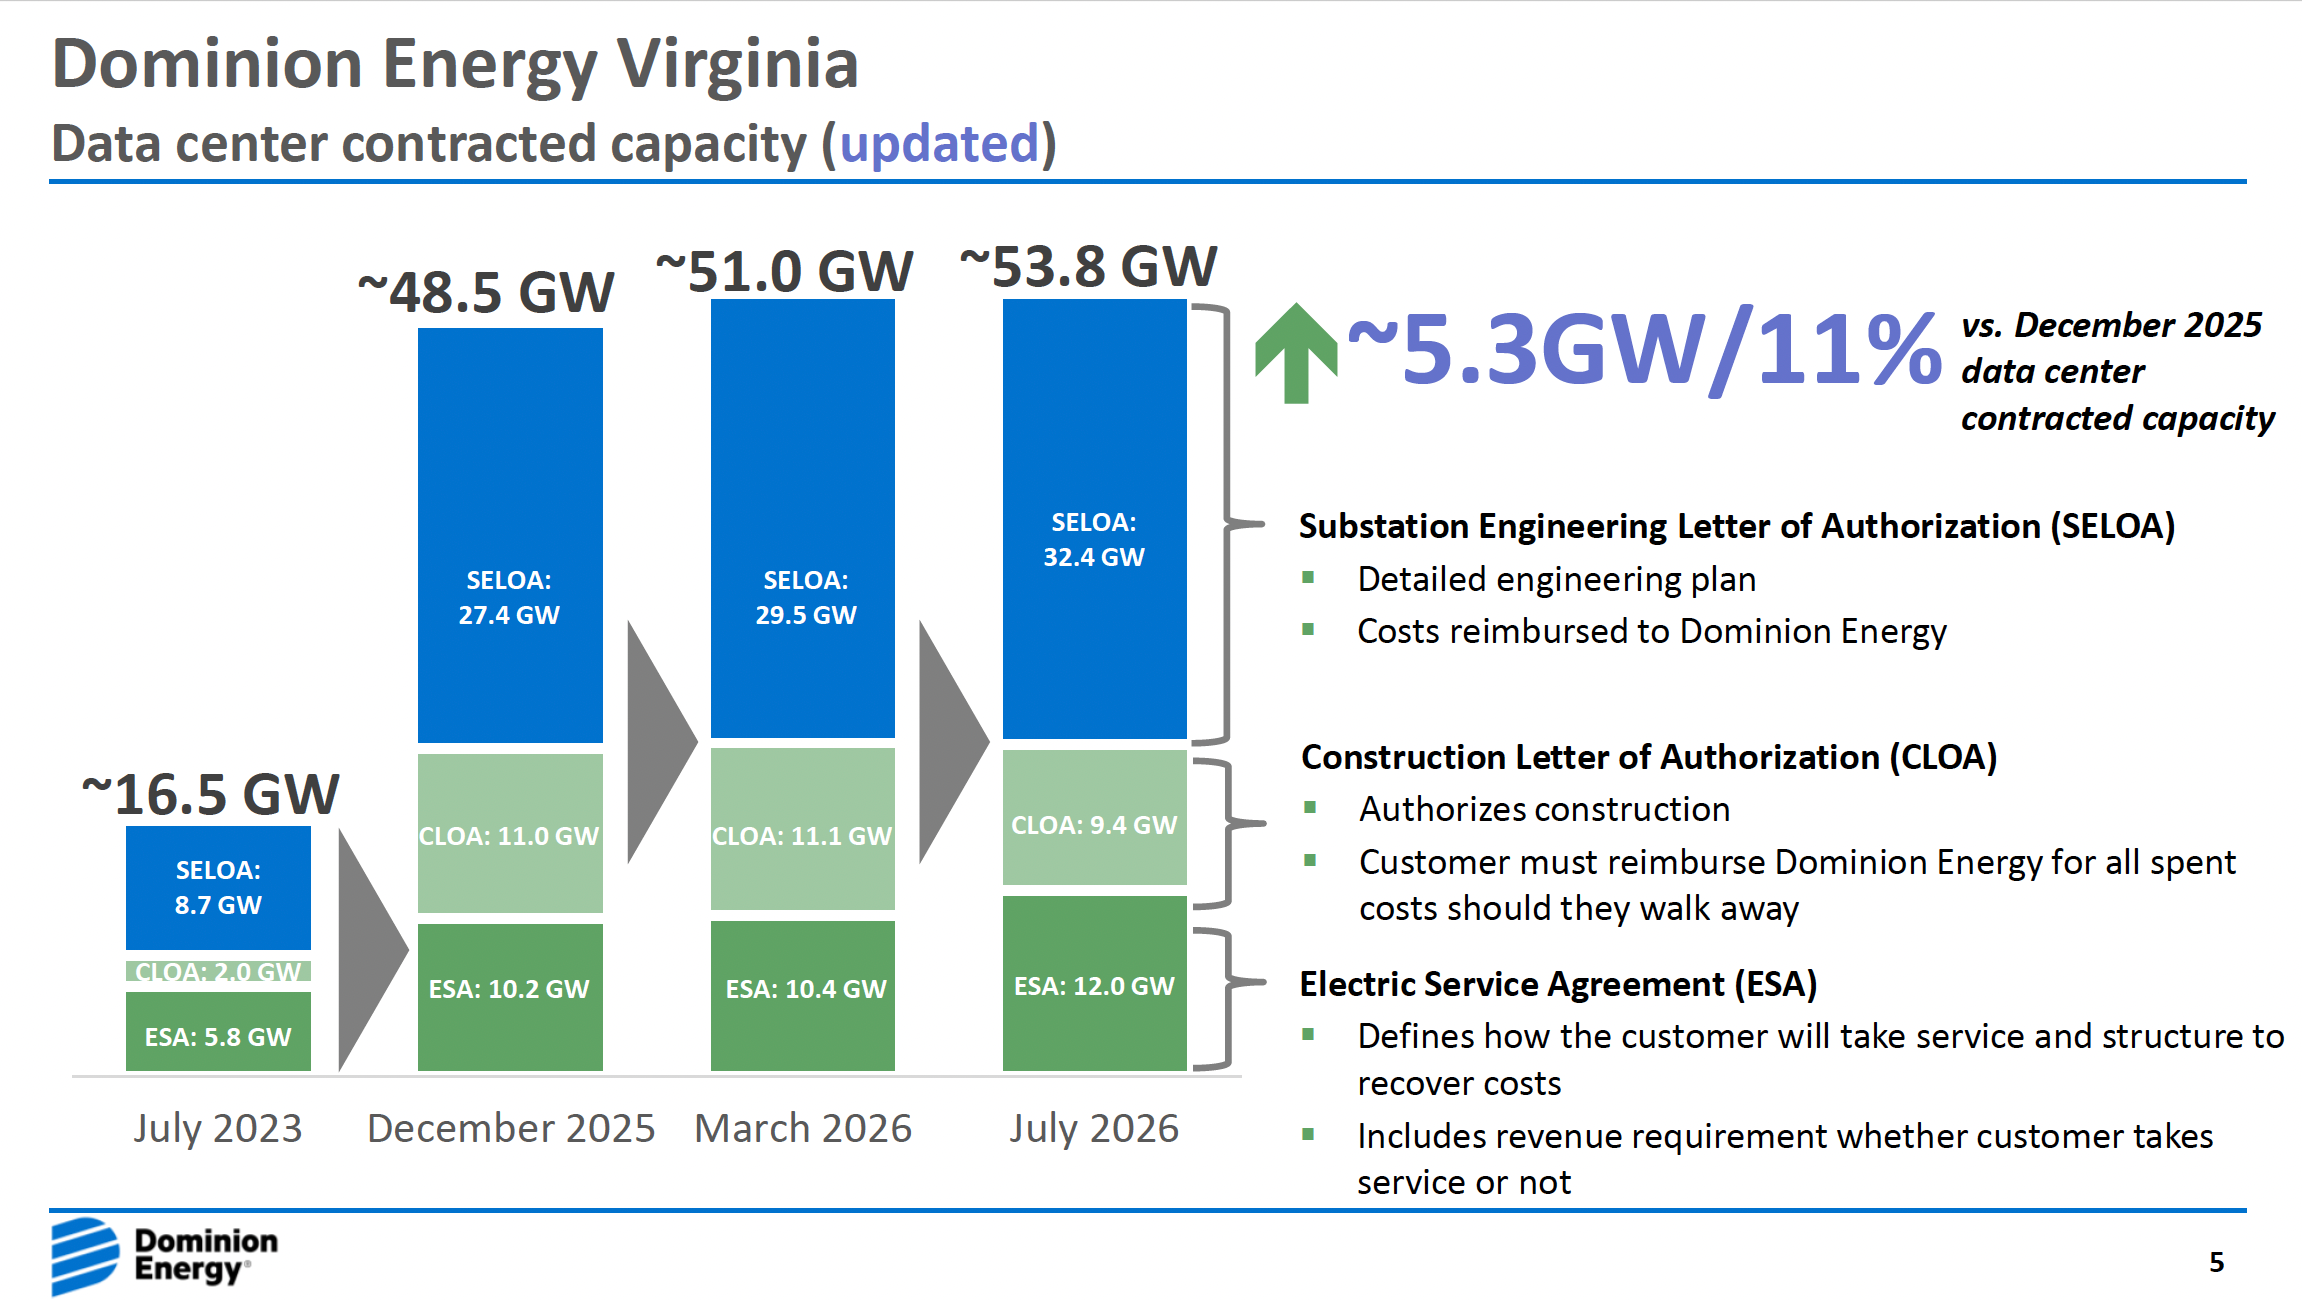
To restate a few of Dominion’s key numbers here:
0.6 GW: new data center power demand added last year
4.8 GW: total data center power demand today
12.0 GW: power demand those data centers have signed contracts to buy
To get to Dominion’s headline 53.8, you might need your calculator app: from 4.8 (current actual demand), add 7.2, the number that’s under contract but not showing up; add 9.4 for data centers that’ve signed a “Construction Letter of Authorization,” which triggers construction for new electrical infrastructure; and finally, add 32.4 for data centers that’ve signed a “Substation Engineering Letter of Authorization.”
It would take more than eighty years, into the 22nd century, to reach 53.8 GW of actual data center electricity demand at the meter’s current pace.
Amazon in Mississippi
For some utilities, one tech company’s plans can be a big deal, and there’s no bigger example of this than Mississippi.
In 2023, Entergy Mississippi’s industrial customers, which include every factory and mill and car plant in its territory, drew a total of 0.27 GW. Then Amazon came to town, and then everything changed.
The first signal was Entergy’s filing with the grid operator in October 2023, when it said it planned to deliver 1.034 GW to a new customer. In January 2024, the Governor called a special session, where the legislature passed a bill to clear the path for two Amazon data center campuses, including letting Entergy build the power plants, and sign Amazon’s contract, without the state utility regulator’s approval. The state, Amazon, and the utility have been sprinting forward ever since.
Entergy’s plan: 2.26 GW of new power plants, plus the substations and wires to serve Amazon. The utility started charging its customers for Amazon’s new infrastructure by July 2024; broke ground on the first plant that November and the second last October; and is currently finalizing permitting for the third plant, which will sit about a mile from one of the data centers. When the data centers came online last summer, Entergy Mississippi’s industrial sales took off. Up 11% year-over-year in August 2025; 44% by December; 92% by February. Though demand hasn’t moved much since then, the new plateau is an obvious step-change from before.
But, wait. That’s big on a percentage basis. What about on a gigawatt basis?
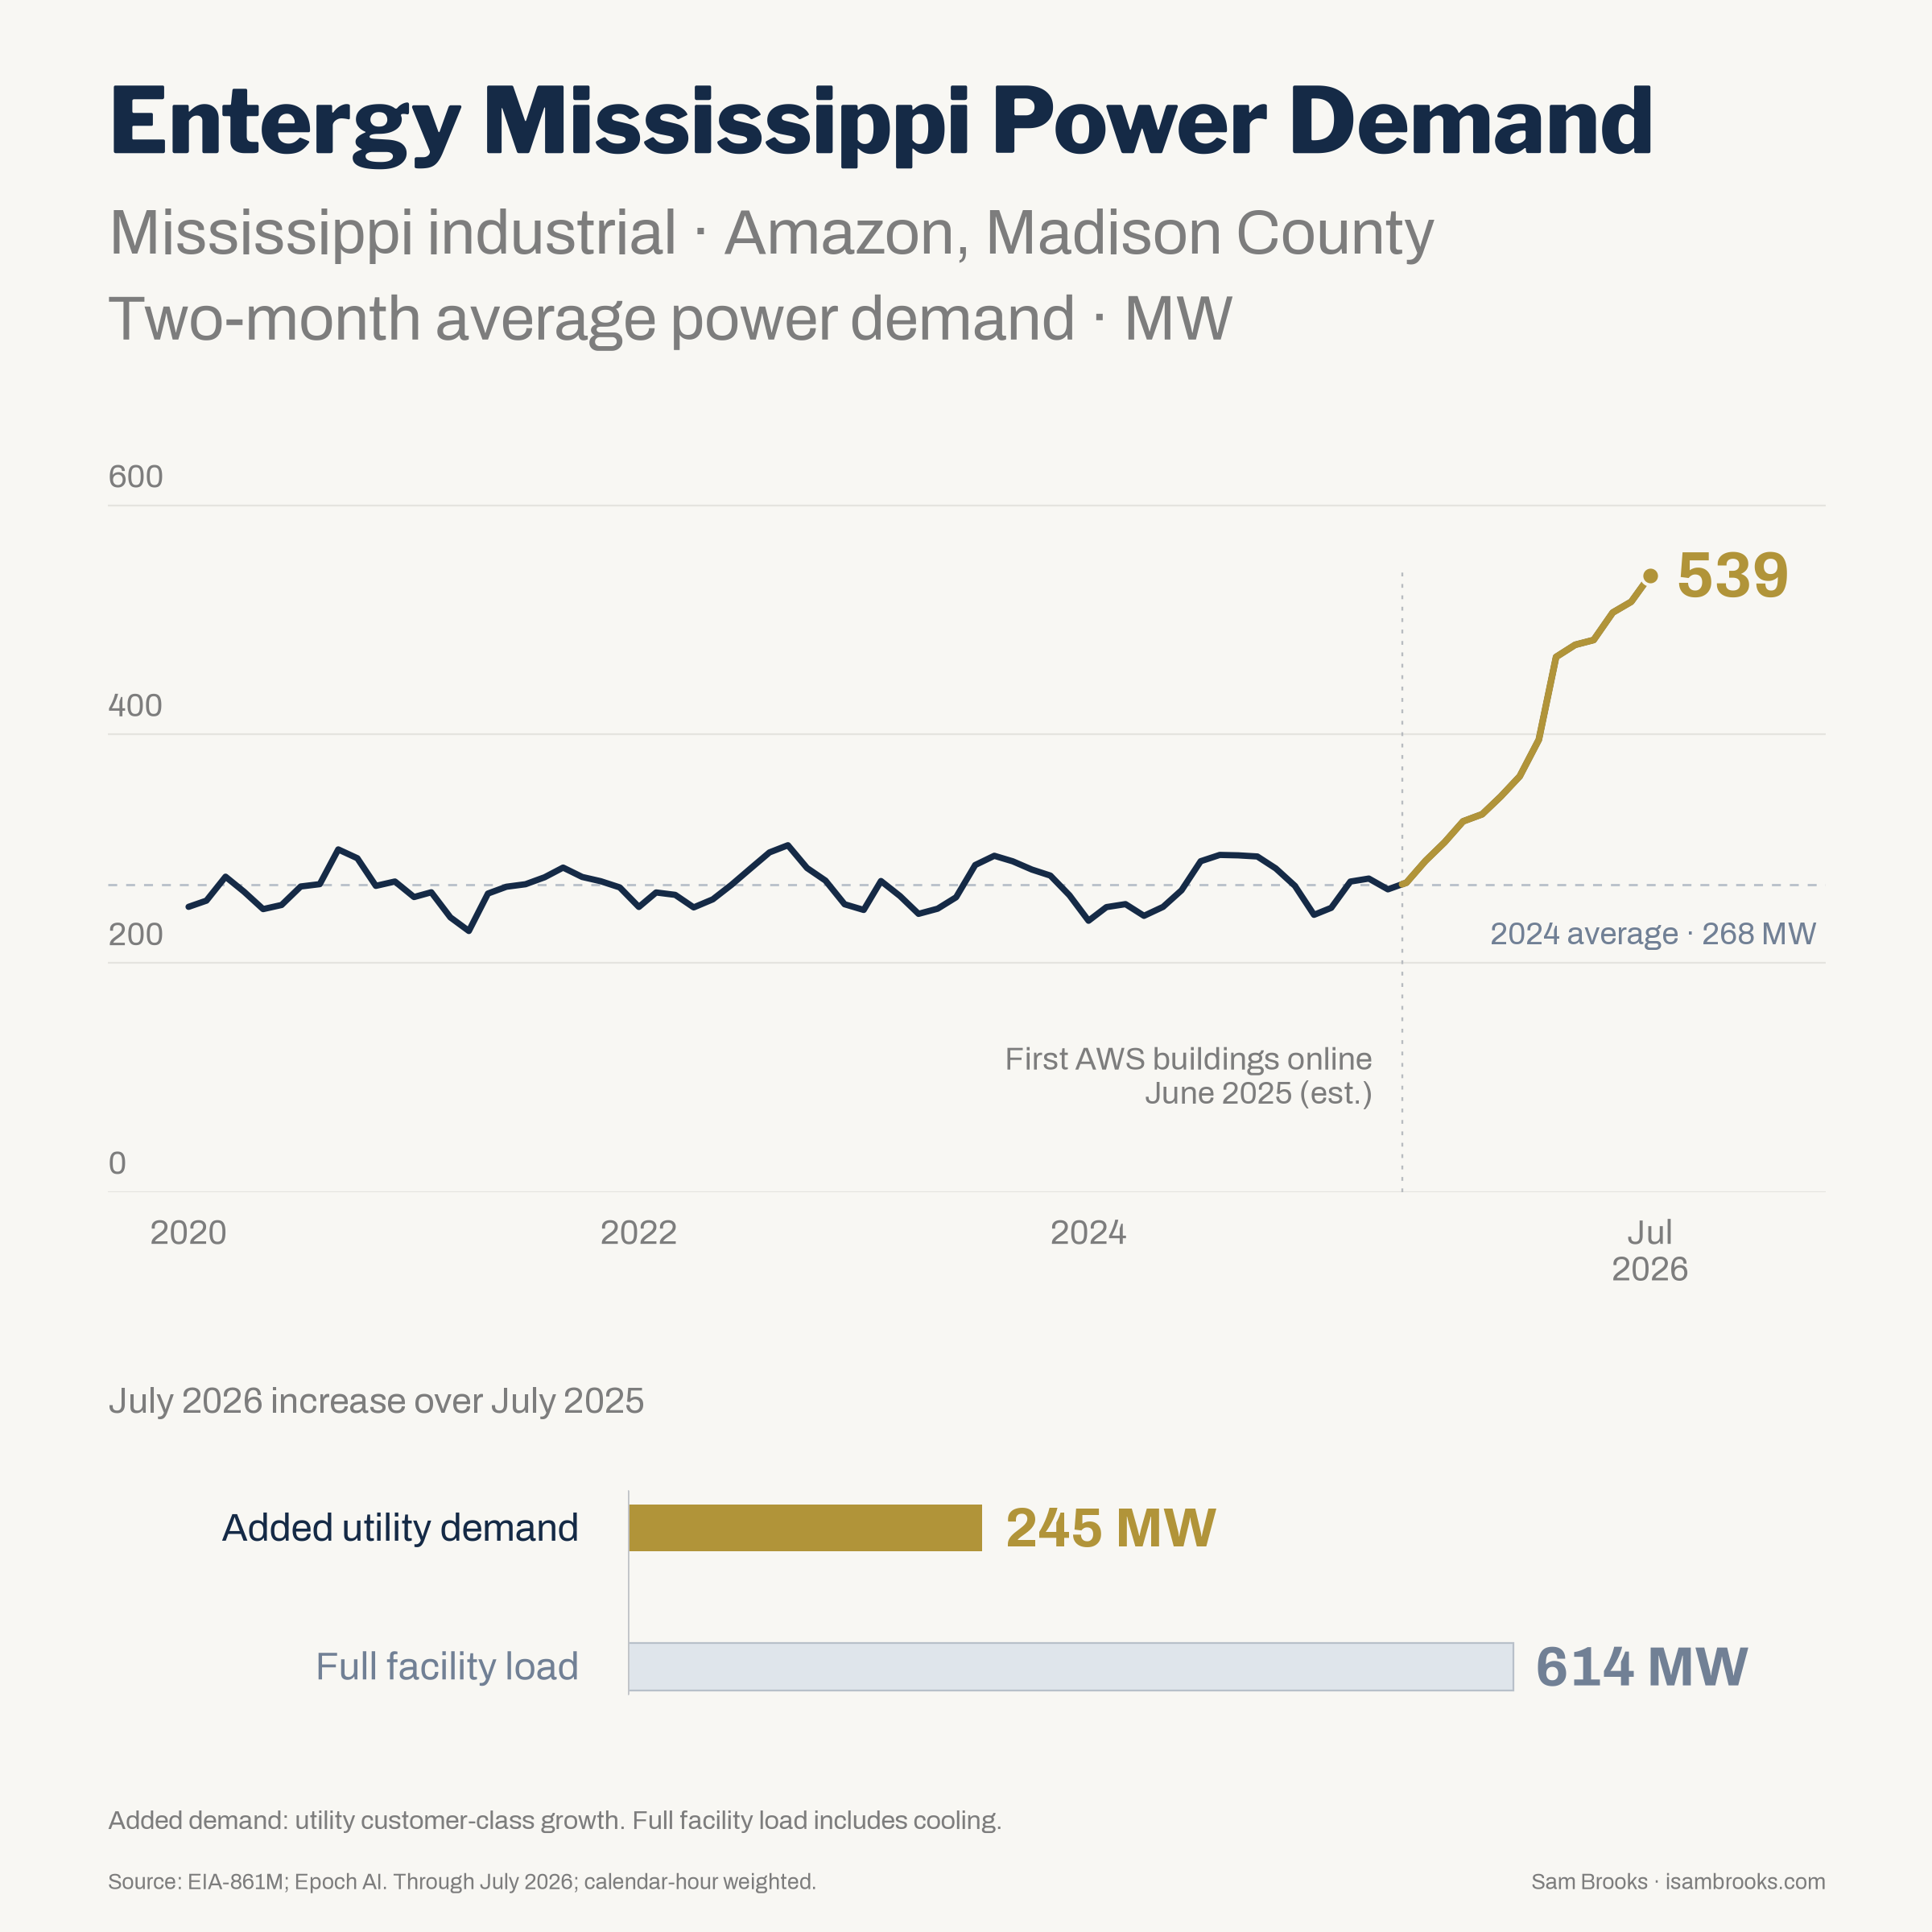
0.25 GW. That was the year-over-year figure in July, roughly where the increase has held since May. Epoch AI, which uses satellite imagery and other sources to estimate how many chips are running where, says that as of May, Amazon’s two campuses in Madison County had nine buildings operating with enough chips inside to draw (cooling included) 0.6 GW. The meter shows 0.25 GW.
Like Dominion, the figures are more clearly described in megawatts, but Entergy Mississippi is charging ahead with plans measured in gigawatts. All told, the package of new power plants and transmission adds up to about $3.8 billion, a number that’ll easily climb to $4 billion, maybe $5 billion, after inevitable budget overruns. Everything Entergy Mississippi owned — every plant, pole and wire, for all of its existing customers — was valued on its books at $5.1 billion at the end of 2023, the last year before Amazon came to town.5
Light, Everywhere
Some other examples where data centers are coming onto the grid lighter than expected.


Microsoft’s Fairwater (Mount Pleasant, Wisconsin). Microsoft calls it “the world’s most powerful AI datacenter.” The campus that Satya Nadella told Wall Street would “scale to two gigawatts alone” went live in April, Nadella said, “ahead of schedule,” with “hundreds of thousands of GB200s” in “a single seamless cluster.” Using satellite data, Epoch estimated the site was online with chips that’d draw approximately 0.44 GW of total power, facility cooling included. By July, the local utility reported industrial power demand was up year-over-year: 0.18 GW. Assuming every watt of that new demand came from Microsoft, sixty percent of the world’s most powerful AI datacenter is sitting idle.
Applied Digital’s data center built for CoreWeave (Ellendale, North Dakota). The utility’s numbers here are small, but the small numbers make it easy to see movement at the meter. Applied Digital told investors in November that its first building “now operates at its full 100 MW critical IT load,” which would equate to 0.12 GW of total facility demand on the grid. The local utility’s meter didn’t move until February, but since then the jump’s been obvious: 0.03 GW more than the year before. In other words: a quarter of what the company said was running.
Amazon’s Project Rainier (New Carlisle, Indiana). This is one of the sites where Anthropic trains its models. When Amazon walked the New York Times through the campus last summer, the number was 2.2 gigawatts, though Epoch’s satellite-based estimate indicates that the operational chips could draw (including cooling) 1.1 GW. Indiana Michigan Power’s commercial demand in Indiana is up about 0.6 GW from July 2024, the last July before the campus switched on. If we assume every single watt of growth is coming from Amazon, the chips Anthropic trains on are running at about half of their total theoretical power.
They Know What’s Going On
Data about data centers — and how much power they’re using — is obviously available to the electric utilities delivering that power. Once in a while, they look at it.
One of Australia’s grid operators has been especially upfront about what’s going on. The Australian Energy Market Operator counted the data centers on its grid and found that the ones running were drawing power at 27% of the grid capacity they’d signed up for. The Australian report also gets into the one thing that makes this complicated: whether the chips are training AI models, or serving them. The conventional wisdom is that while training runs chips flat out, serving chatbots doesn’t, because there’s more demand at 3pm than 3am. But Australia found something interesting: all together, including inference, the data centers are actually running at about 90% of their own peak, which roughly mirrors estimates from at least two US-based utilities. This suggests the tech companies have figured out how to utilize their chips so that the swings in chatbot demand don’t significantly swing power demand, which means that even if used for inference, a data center that peaks at a gigawatt should be expected to use, on average, about 0.9 gigawatts of power.
Some American utilities have let the truth out, too. In Omaha, the public utility’s 2026 operating plan includes its consultant’s finding that big customers hand in growth schedules that “have typically outpaced actual customer meter reads.” Duke’s CFO told investors the company now risk-adjusts its forecasted sales “basically to the minimum billing demands.”
More often, the utilities fight the data. In Texas, AEP Texas and Oncor asked regulators to strip the grid operator of the power to adjust utility forecasts using “historical realization rates” (i.e., what actually showed up). In Indiana, Amazon, Google and the Data Center Coalition opposed publishing actual numbers, instead of broad ranges, on big customers’ electricity use.
And sometimes, the people who work for the regulators say it out loud. Georgia’s utility regulators were warned, by their own staff, that the data centers were coming in light. In May 2025, the staff checked the three operating data centers against what they had announced for 2024: 37% of their planned load actually showed at the meter.
Last November, the staff said Georgia Power’s forecast for its big new customers was running 84% above what they actually drew. The operating projects were using much less than forecast, and they specifically pointed out the lighter-than-expected demand “does not represent a delay in the in-service date, but specifically a lower level of load materialization.” As for the future pipeline: “Only about 1,900 MW is supported by such contracts. The rest is speculative.”
Georgia: F It, We’re Building Anyway
In February, the CEO of Georgia Power’s parent, Southern Company’s Chris Womack, called demand growth “arguably unprecedented,” and the company told investors all year that its pipeline of big customers, mostly data centers, stands at over 75 GW.
Back on planet earth, in July, Georgia Power’s commercial customers (where it logs data centers) used 5.1 GW, up from 4.8 GW last July. A 0.3 GW move isn’t nothing — and the best explanation is Microsoft’s other Fairwater campus, outside Atlanta, which I’ve now written about at length — but also, it’s kind of nothing. Georgia Power tells Wall Street its sales will grow about 13% a year through 2030. Last year, total sales grew just 2.4%.
Georgia Power’s own paperwork admits the data centers are coming in light, in its way. It files a “pipeline report” every quarter, and the June one reads like the last several: 6.8 GW of new projects joined the line, while the projects already in it pushed 2.2 GW of the load they’d promised for 2028 into later years. Of the ten projects that changed their start dates, eight of them moved back. The report’s own explanation for why its near-term number fell while its total rose: “changes in projected near-term load ramps.” Even OpenAI’s campus — 3.2 GW, the biggest deal in the state — slid a year, from full power in 2031 to 2032, between the March and June reports. The near term keeps shrinking, while the far term keeps growing. The hockey stick is always next year.
Georgia Power is building anyway, its own meters and its regulator’s staff be damned. It won approval last December from elected regulators for 10 GW of new power — including $16 billion of company-owned, profit-generating assets — but they’re already planning for more. On July’s call with Wall Street, Womack said the OpenAI deal “pushes us … right around 1 gigawatt” past what regulators approved in December.
Up 0.3 gigawatts in the last year, and another 75 gigawatts on the way.
In future pieces, I’ll deepen the investigation to include at least two new avenues to measure load (i.e., data sets beyond the data used here, which was mostly: Texas Gas Transmission data; xAI’s turbine runtime report; submissions to the SEC and EIA). I’m close, but not quite there, to close the loop on both. My instinct is that I’m likely being conservative; in other words, that data centers are using even less power than I’ve stated here.
The long story:
SpaceX’s compute claim. SpaceX’s Q2 SEC report says: “We calculate nameplate compute draw for a period as the number of GPUs installed in our data centers at the end of the period multiplied by their respective all-in power draw. Nameplate compute draw reflects installed capacity and does not represent actual power consumption or utilization.” As of June 30, 2026: 1.4 GW.
The SEC filing doesn’t break that down by site, but Musk did: “Colossus 1 is 150k H100, 50k H200 and 30k GB200. Colossus 2 is 110k GB200 and 440k GB300.” At about 1.3 kilowatts per H100 or H200 (Nvidia rates its eight-GPU H100 system at 10.2 kW max, and SpaceX’s own prospectus puts its first “approximately 100,000 H100 processors” at “approximately 130 megawatts”), and about 1.9 per GB200 and 2.0 per GB300 (Nvidia puts a 72-GPU GB200 rack at “approximately 120kW,” about 1.7 per GPU, before the networking and storage an “all-in” number includes), Musk’s chips come to 0.32 GW at Colossus 1 and 1.09 GW at Colossus 2 — 1.41 in total, matching the 10-Q’s 1.4.
Musk on January 17, 2026: “Colossus 2 now operational. First Gigawatt training cluster in the world. Upgrades to 1.5GW in April.”
The turbines are Colossus 2’s only power. SpaceX’s 10-Q, describing the NAACP’s Clean Air Act suit, refers to “the mobile gas turbines powering the COLOSSUS II data center.” Memphis’s utility, MLGW, in a July 22, 2025 statement: “MLGW is not supplying power to their supercomputer, Colossus 2.”
The gas. Federal rules require interstate pipelines to post, every day, how much gas is scheduled at each delivery point (18 CFR 284.13 (d))). Texas Gas Transmission’s daily “Operationally Available Capacity” report detailed delivery to point 26096, “MZX Southaven.” Texas Gas’s own list of its locations names the company at that point, MZX Tech LLC, and MZX Tech is the xAI company that runs the turbines (more below).
On June 30, 2026, the Total Scheduled Quantity was 177,000 MMBtu. The day before, 175,000; July 1, 176,990. Every day from July 8 through July 17 reads exactly 177,000. (That’s each day’s last posted schedule. The day’s first schedule, “Timely,” sometimes opens higher and gets cut back: July 10 opened at 262,818 and finished at 177,000.) The schedule steps up to 180,000 on July 18, 190,000 on July 29, and 195,000 for most of August.
In addition to the scheduled quantity for each day, subsequent filings provide data about the so-called “no notice” deliveries of power. Those figures have been incorporated into the figures used for the estimates above. Specifically, per the “no notice” report, the June 30 quantity of 177,000 is adjusted upward by 7,800 to 184,800.
From gas to power. Three assumptions, plus math.
The site burned all the gas it scheduled, and June 30 is a fair stand-in for the rest of June. (Earlier June days have aged off the pipeline’s public listing.) If June averaged less than 177,000 a day, the gas-based number would be lower, too. In reality, given that the figure has trended up during the year, the 177,000 figure likely overstates how much gas was consumed (and thus power generated) on the site during June.
Heat rate: how many Btu of gas a turbine burns to make a kilowatt-hour. I used the Energy Information Administration’s average for gas turbines, 10,999 Btu per kilowatt-hour (EIA, Electric Power Annual, Table 8.2). EIA’s gas-turbine average has been between 10,999 and 11,378 since 2014; anywhere in that band, 177,000 MMBtu a day comes to between 0.54 and 0.56 GW of IT power (at a PUE of 1.2).
PUE. Computer chips aren’t the only thing drawing power in a building: there are other uses of electricity, mostly to cool the chips, which get hot when they run. See the note at the end for more on the possible range of PUEs, which Grok estimated at 1.1 to 1.4 for Colossus 2.
Three questions: Is customer 26096 xAI? Texas Gas’s location list names the customer: MZX Tech LLC. MZX Tech LLC is: the permittee on Mississippi’s air permit for the Stanton Road turbines (MDEQ permit 0680-00119); the company in MDEQ’s July 30, 2026 order on the turbines at 2875 Stanton Road; X.AI Corp.’s co-defendant in the Clean Air Act case SpaceX describes in its 10-Q. Did xAI have another pipe or another account? Texas Gas lists a second physical point, 26135, “MZX Southaven #2,” that hasn’t posted any volume. Was xAI regularly burning more gas than it scheduled? Taking more gas than you schedule throws the pipeline out of balance; pipelines charge penalties for it and can even cut off supply.
All three questions were answered by the turbine runtime log, which describes a fleet of gas turbines that use about 177,000 MMBtu a day.
The turbine runtime log. On June 17, 2026, the chief of Mississippi’s Air Division asked xAI’s environmental consultant, Trinity Consultants, for “the typical average daily operational time for all units (i.e., 1 through 60).” On July 10, Trinity sent back a table: Unit, Unit Type, Control, Total Power Output, Date Added, June Hours, June Daily Avg. The PDF is MDEQ’s copy of the email chain; Rachel Hurley posted it in full with her records for the upcoming hearing (PDF).
Sixty units, 1,445 MW: 34 GE TM2500s (20 to 35 MW each, 903 MW), 14 Solar SMT-130s (13 MW each, 182 MW) and 12 Mitsubishi FT8s (30 MW each, 360 MW). With June’s 720 hours, the turbines could have run 43,200 turbine-hours. They ran 21,439, an average of 357 hours per unit. Fifteen ran 600 hours or more; unit 30 ran all 720; eight ran zero. Each unit’s megawatts times its hours, summed: 477,494 megawatt-hours. Divided by 720 hours: 663 MW. Divided by 1.2 (PUE): 553 MW of chips.
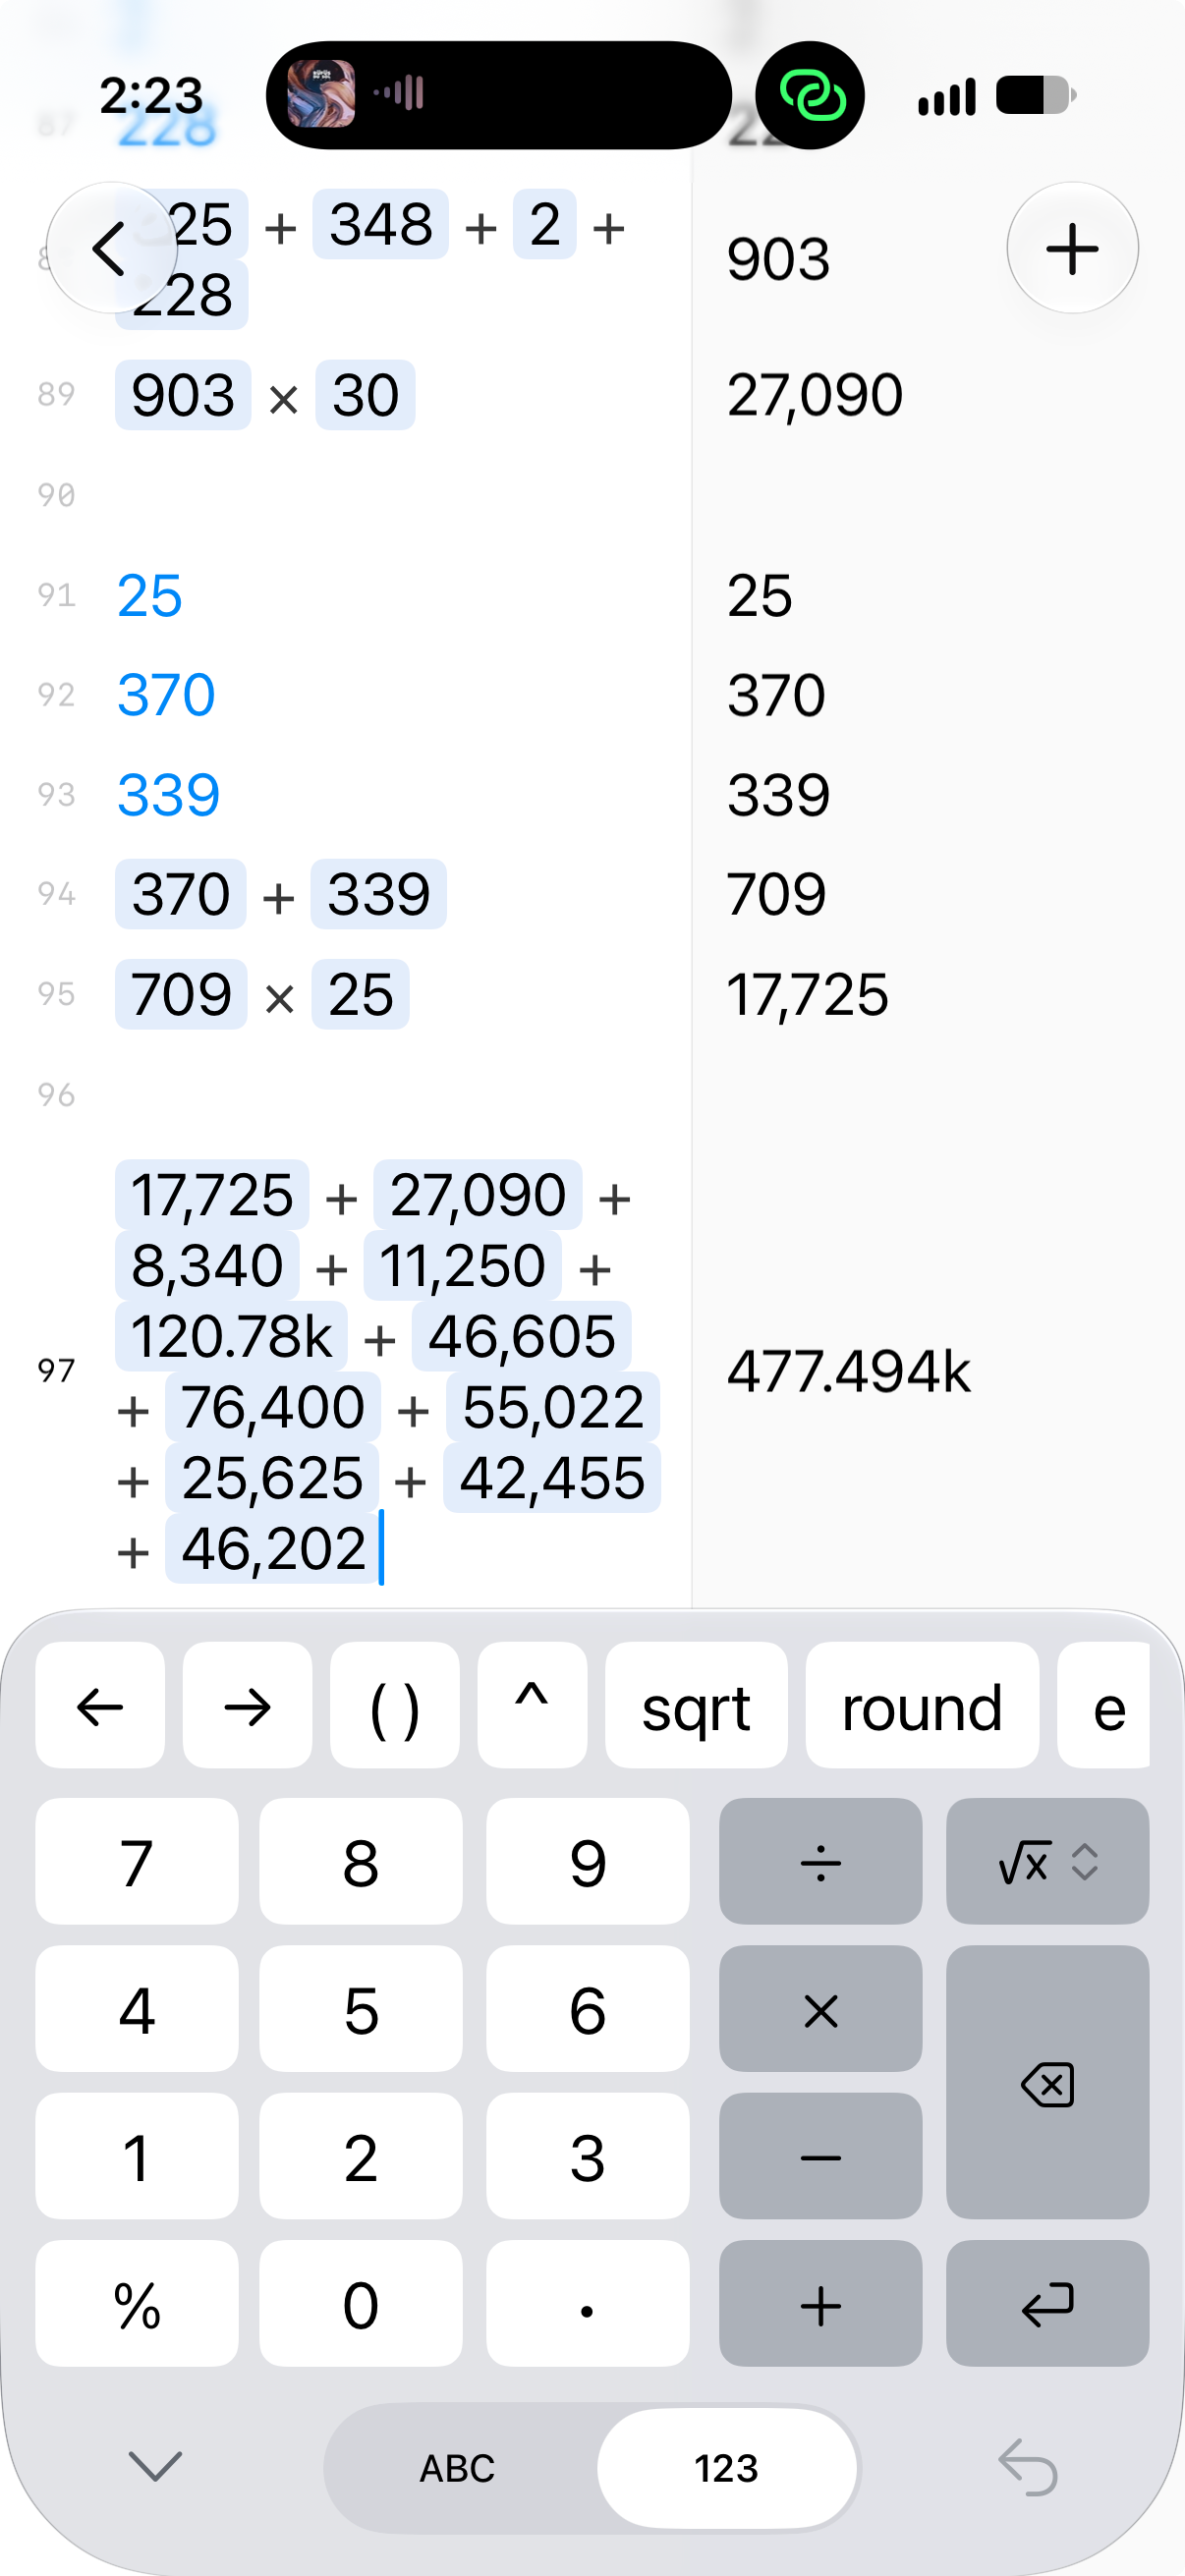
That credits every running turbine with its full listed rating for every hour it ran, which makes it a ceiling: if the running units averaged less than their listed output, the chips drew less. The gas says they ran close to their listed ratings. At 90% of listed output, 177,000 MMBtu a day would mean a heat rate of about 12,400, 12% worse than EIA’s average.
The two independent records land within six megawatts of each other: 0.559 GW of chips from the gas at EIA’s heat rate, 0.553 from the turbine run log.
Sanity check on the gas math. TVA’s Southaven combined-cycle plant takes gas from the same pipeline at the next point over (location 9198): 113,572 MMBtu on June 30. At EIA’s average for combined-cycle plants, 7,548 Btu per kilowatt-hour (same table), that’s about 627 MW. TVA rates the plant at 774 MW in summer, so that sounds about right for a hot June day. You can also see here how and why the Colossus turbines create more pollution: a simple-cycle turbine takes about 46% more gas to make a kilowatt-hour than a combined-cycle plant. This is one (good) reason why clean air advocates have criticized the Colossus 2 setup.
IT load → facility load conversions. Throughout this article, I’ve frequently converted the power draw for computer chips (often referred to as “IT compute” or “IT critical load”) into a power draw for the entire data center facility. A computer chip generates a lot of heat when it runs, which requires the building to cool the chips, which means the building uses a material amount of (non-chip) power. I’ve accounted for this with a Power Usage Effectiveness (PUE) assumption of 1.2.
To sanity-check this assumption (among approximately 394 sanity checks for this piece), I asked Grok to estimate Colossus 2’s average facility electricity load for June 2026 and to include a specific estimate for PUE. Grok’s best guess: PUE of 1.25.
(Note: Using its estimated average IT load of 875 MW, Grok estimated total facility load of roughly 1,050 - 1,250. (Grok sort of screwed up the facility load, below. After estimating the average IT load, in addition to peak IT load, it forgot to account for average-vs-peak when doing the below PUE sensitivity analysis. Anyway, none of these figures is even close to the real one.)
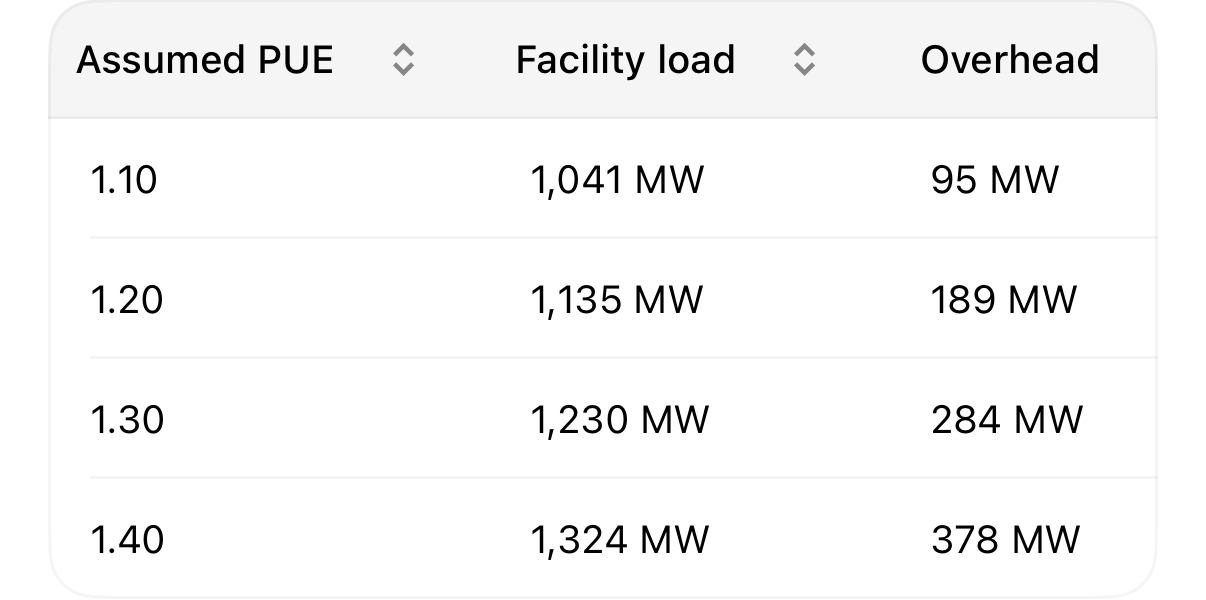
The turbine-derived figure is awfully close to the gas-derived figure (within 6%), which helps reinforce and improve the confidence of the power generation/consumption estimates herein. Among other things, this makes me more confident that my estimate isn’t missing a large amount of generation. This matters because if I’d only had the turbine data (and didn’t have the gas data), I’d have published this estimate, but I’d have hedged, because I would’ve wondered if xAI was not disclosing all of its turbines in the email to regulators. But by triangulating this with the gas data, I’m confident all of the turbines are accounted for and that this estimate is accurate.
Musk's shortfall has been "next year" for three years running. Berlin, March 2024: "I think next year, you'll see they just can't find enough electricity." CNBC, May 2025: "maybe by the middle of next year, end of next year." And in his same G20 remarks, his account of how SpaceX got around the shortage: Google and Anthropic are leasing compute from SpaceX "by constructing our own power plants. It's the only way we were able to do it." Those power plants are the sixty turbines in this piece, and in June they ran at 46 percent.
In order to get a sense of the AI chip economics, it’s helpful to compare them to another kind of equipment: turbines that burn gas to generate electricity.
This is familiar terrain — because I’ve spent much of my career all-but yelling at utilities: hey dummies, you’re wasting tons of money by not better utilizing your power-generating assets! (When utilities buy expensive infrastructure and don’t use it, it’s infuriating, because they’re just passing the cost of the assets through to everyone with a power bill.)
When it comes to chips, the assets don’t appear to be utilized well, either. But the differences in scale are staggering, and the scale here makes what the tech companies are doing especially dumb. A comparison of rental rates for both pieces of equipment — what Anthropic pays SpaceX for its chips (using Anthropic to be conservative; Google’s figure is two-thirds higher), converted to gigawatts, versus an imputed rental rate for a combustion gas turbine:
$427,000 per gigawatt, per day: cost to rent a gas turbine (PJM’s estimate of what a new one costs to build, finance and maintain, 2026/27)
$82 million per gigawatt, per day: cost to rent AI compute (Anthropic’s $1.25 billion a month for about 0.5 GW of chips)
See what’s happening here? It’s already dumb enough when expensive gas turbines aren’t fully utilized — when utilities buy expensive assets they don’t fully utilize — but, if you’re not fully utilizing AI chips, that is REALLY F’ING DUMB.
One more swing here, with a simpler analogy. Imagine you own a restaurant where the kitchen cost $100k, but then in your infinite wisdom you decide to expand with a new kitchen that costs $1 million. You better fully utilize that kitchen.
RE Anthropic and Google’s annual run rate (iykyk): SpaceX’s prospectus says Anthropic is paying $1.25 billion a month for about 325,000 GPUs, or about 0.5 GW at the per-chip figures in Footnote 1. That’s $15 billion a year for 0.5 GW, or $30 billion per gigawatt. Google pays $920 million a month for 110,000 GPUs (about 0.22 GW): $11 billion a year for 0.22 GW; about $50 billion per gigawatt.
RE “$3.8 billion”: Entergy’s three gas plants (it says “approximately $3.5 billion”: $1.2 billion, $1.2 billion and “more than $1 billion”) plus the three substations in the 2023 filing with the grid operator ($282 million).
Cross-checking the gas nominations against the turbine runtime table is a good way to separate announced gigawatts from energized ones, and the gap you show on Colossus 2 is the kind of thing queue headlines hide. The same split shows up in market scoring: on DC Hub's Data Center Power Index (dchub.cloud), as of Oct 9, Atlanta scores 20.6 in the AVOID band while Oklahoma City scores 67.1 in BUILD. Do you expect regulators to start asking for evidence of energized load before approving the plants and wires built for it?